
Building technology / Energy, water and waste
See resource use in context
Connect energy, water and waste information to the actions and reporting that support your building strategy.
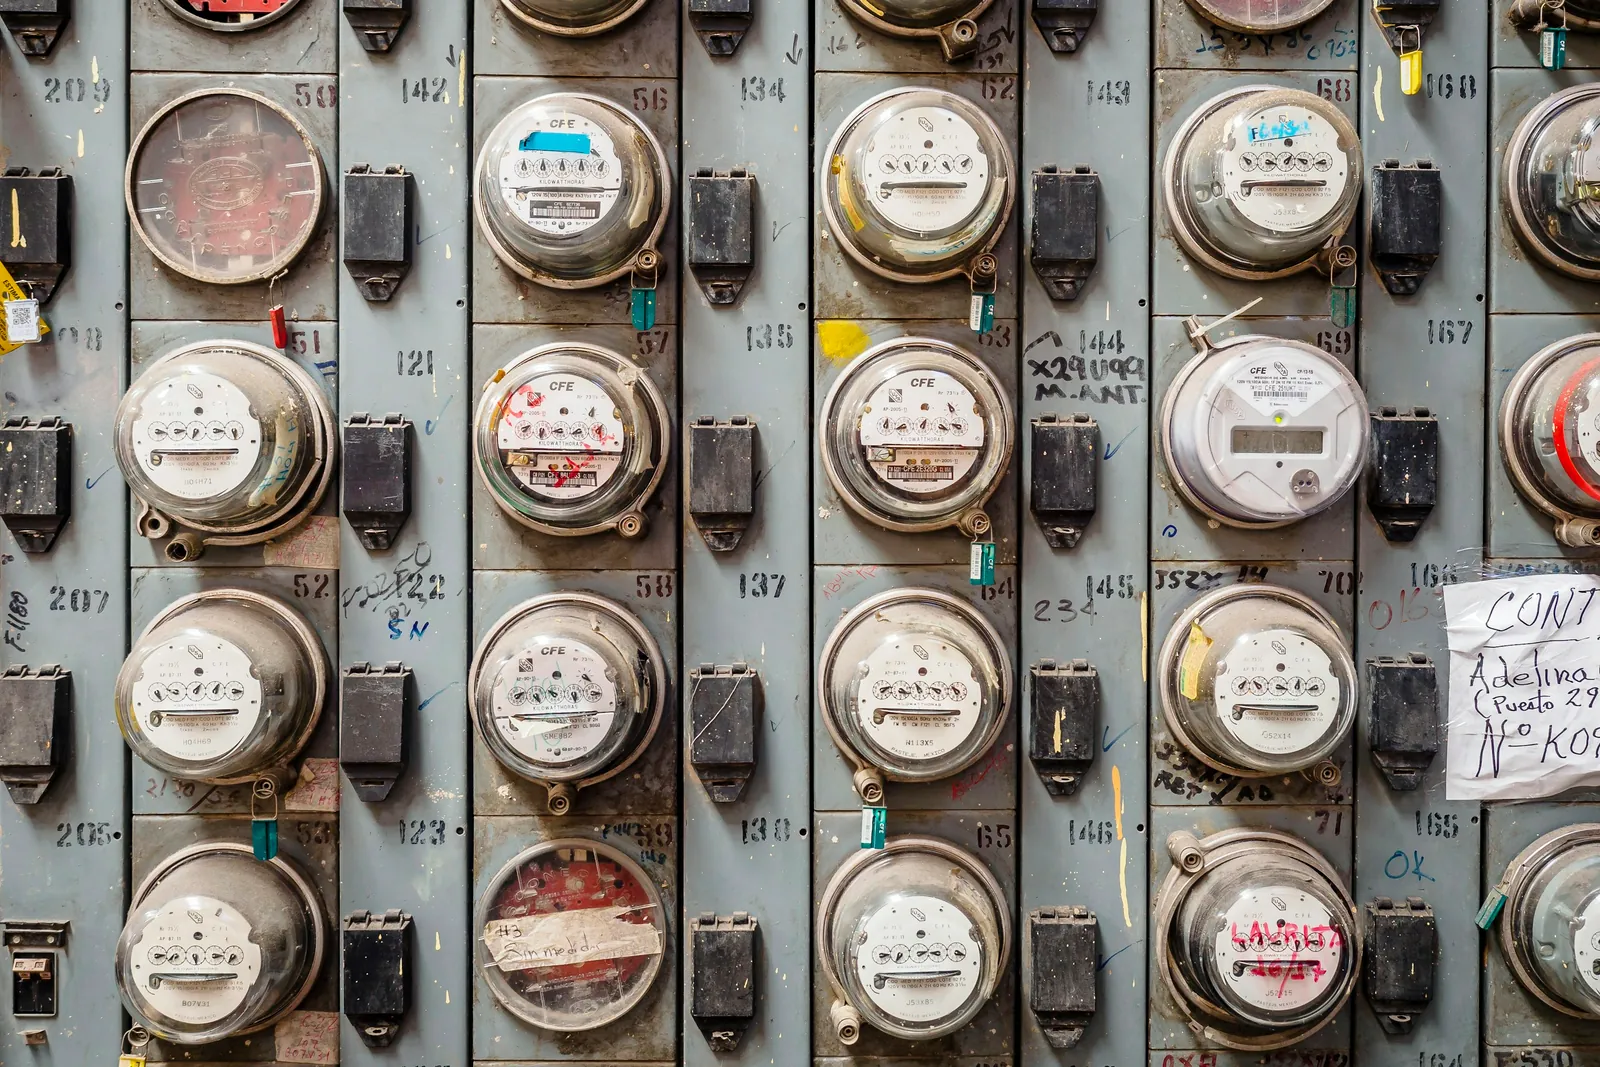
Does resource use follow the way the building is occupied and operated, and what needs investigation?
Put the measurement in the right frame.
Building information helps your team identify where to act. Compare electricity demand with occupancy, investigate water use outside expected hours or review waste quantities by stream and source to understand collection patterns.
We define the areas, uses and periods each measure represents, its completeness and the source owner. This gives the team a consistent basis for investigation and reporting.
Connect information with a response.
We work back from the action the team needs to take. A trend, exception or baseline comparison can prompt a schedule review, a possible-leak investigation, reconciliation of missing records or a change to collection arrangements.
We specify the measurements, interfaces and reporting views that support those actions. Operating teams and appointed specialists investigate the findings and approve or carry out physical and control changes.
Keep reporting traceable.
A chart is most useful when its units, source, period and gaps are understood. Occupancy, weather, operating hours and base loads can affect consumption. Recorded waste weights do not by themselves prove final recycling or carbon impact.
Your team receives information it can trace, interpret and use to review progress against the agreed outcomes.
Information with a purpose.
Building information / an illustrative example
Move along the timeline. Use the arrow keys when the control is focused.
Read sample values
| time local | people count | electricity demand kw | boundary | status |
|---|---|---|---|---|
| 06:00 | 0 | 19 | illustrative office floor | synthetic |
| 07:00 | 3 | 21 | illustrative office floor | synthetic |
| 08:00 | 18 | 27 | illustrative office floor | synthetic |
| 09:00 | 64 | 39 | illustrative office floor | synthetic |
| 10:00 | 90 | 48 | illustrative office floor | synthetic |
| 11:00 | 104 | 53 | illustrative office floor | synthetic |
| 12:00 | 96 | 51 | illustrative office floor | synthetic |
| 13:00 | 72 | 49 | illustrative office floor | synthetic |
| 14:00 | 100 | 54 | illustrative office floor | synthetic |
| 15:00 | 111 | 57 | illustrative office floor | synthetic |
| 16:00 | 97 | 54 | illustrative office floor | synthetic |
| 17:00 | 74 | 49 | illustrative office floor | synthetic |
| 18:00 | 42 | 40 | illustrative office floor | synthetic |
| 19:00 | 15 | 33 | illustrative office floor | synthetic |
| 20:00 | 4 | 29 | illustrative office floor | synthetic |
| 21:00 | 0 | 27 | illustrative office floor | synthetic |
| 22:00 | 0 | 26 | illustrative office floor | synthetic |
Building information / an illustrative example
Move along the timeline. Use the arrow keys when the control is focused.
Read sample values
| hour start local | mean flow litres per hour | boundary | status |
|---|---|---|---|
| 00:00 | 24 | illustrative office supply | synthetic |
| 01:00 | 23 | illustrative office supply | synthetic |
| 02:00 | 25 | illustrative office supply | synthetic |
| 03:00 | 24 | illustrative office supply | synthetic |
| 04:00 | 24 | illustrative office supply | synthetic |
| 05:00 | 26 | illustrative office supply | synthetic |
| 06:00 | 42 | illustrative office supply | synthetic |
| 07:00 | 95 | illustrative office supply | synthetic |
| 08:00 | 155 | illustrative office supply | synthetic |
| 09:00 | 192 | illustrative office supply | synthetic |
| 10:00 | 160 | illustrative office supply | synthetic |
| 11:00 | 142 | illustrative office supply | synthetic |
| 12:00 | 185 | illustrative office supply | synthetic |
| 13:00 | 170 | illustrative office supply | synthetic |
| 14:00 | 155 | illustrative office supply | synthetic |
| 15:00 | 143 | illustrative office supply | synthetic |
| 16:00 | 131 | illustrative office supply | synthetic |
| 17:00 | 110 | illustrative office supply | synthetic |
| 18:00 | 77 | illustrative office supply | synthetic |
| 19:00 | 48 | illustrative office supply | synthetic |
| 20:00 | 31 | illustrative office supply | synthetic |
| 21:00 | 27 | illustrative office supply | synthetic |
| 22:00 | 25 | illustrative office supply | synthetic |
| 23:00 | 24 | illustrative office supply | synthetic |
Building information / an illustrative example
Read sample values
| recorded stream | recorded mass | unit | boundary | status |
|---|---|---|---|---|
| Mixed recycling | 480 | kg | illustrative disposal points / week | synthetic |
| Food | 260 | kg | illustrative disposal points / week | synthetic |
| General waste | 340 | kg | illustrative disposal points / week | synthetic |
| expected daily point records | received records | missing records | coverage | status |
|---|---|---|---|---|
| 35 | 32 | 3 | five disposal points x seven days | synthetic |
What to agree before choosing technology
- Electricity demand and consumption with defined meter coverage
- Water-use trends and investigated exceptions
- Waste quantities, attribution and completeness
Continue exploring
Where are you on your smart building journey?
Tell us about the building, your priorities and what you want to achieve.