
Building technology / Air quality and indoor conditions
Understand the conditions people work in
Plan indoor conditions monitoring that helps your team understand the workplace, investigate findings and review agreed outcomes.
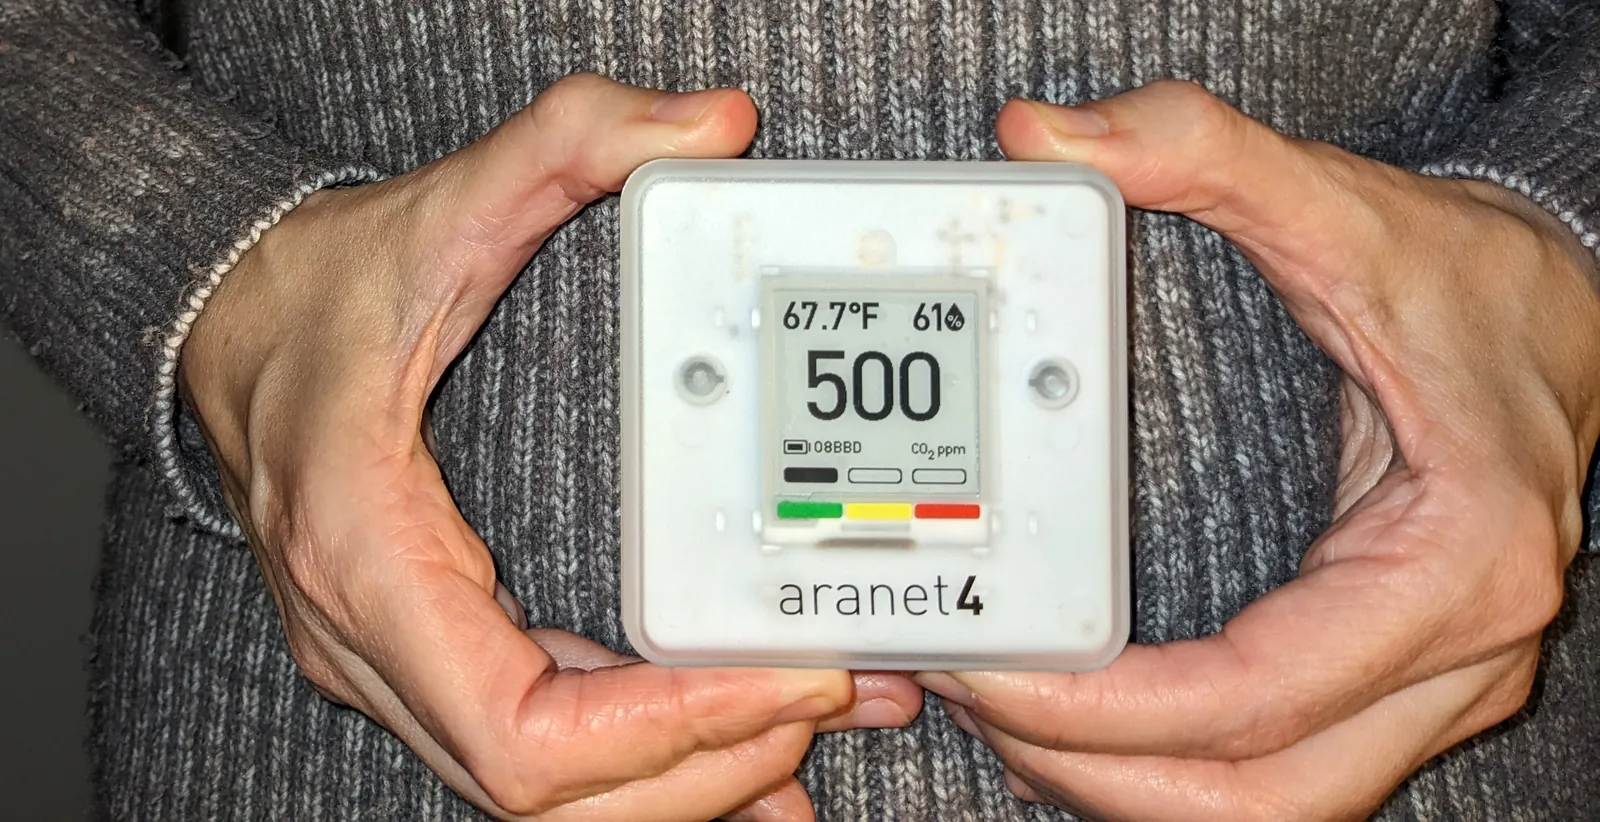
How do indoor conditions change with workplace use, and who investigates the findings?
Measure for a purpose.
Start with the conditions your team needs to understand. Carbon dioxide, particles, volatile organic compounds, temperature and humidity each answer different questions; they need distinct measures and interpretation.
We define the information requirements and compare sensing options against coverage, measurement needs, connectivity and upkeep. We coordinate placement and specialist requirements with your appointed teams.
Bring occupancy and conditions together.
View a meeting room over an occupied day. Relating arrival and departure patterns to changes in carbon dioxide or temperature gives the operating team context for deciding what to investigate.
We specify aligned timestamps and room boundaries, clear units and visible missing or stale readings. These observations support investigation; establishing a cause or health outcome requires the relevant assessment.
Make the information understandable.
A room display or workplace application should explain what is being measured and where. Clear labels, trends and context help people interpret the information and understand the response.
We define the information views, response ownership and evidence needed for operation and relevant reporting. Where certification is an objective, the appointed assessment team confirms the applicable requirements and evidence; sensors alone do not establish a rating.
Information with a purpose.
Building information / an illustrative example
Move along the timeline. Use the arrow keys when the control is focused.
Read sample values
| time local | people count | co2 ppm | boundary | status |
|---|---|---|---|---|
| 06:00 | 0 | 430 | illustrative meeting room | synthetic |
| 07:00 | 0 | 425 | illustrative meeting room | synthetic |
| 08:00 | 2 | 440 | illustrative meeting room | synthetic |
| 09:00 | 6 | 610 | illustrative meeting room | synthetic |
| 10:00 | 9 | 790 | illustrative meeting room | synthetic |
| 11:00 | 12 | 920 | illustrative meeting room | synthetic |
| 12:00 | 4 | 850 | illustrative meeting room | synthetic |
| 13:00 | 2 | 650 | illustrative meeting room | synthetic |
| 14:00 | 8 | 740 | illustrative meeting room | synthetic |
| 15:00 | 10 | 890 | illustrative meeting room | synthetic |
| 16:00 | 6 | 810 | illustrative meeting room | synthetic |
| 17:00 | 3 | 690 | illustrative meeting room | synthetic |
| 18:00 | 0 | 580 | illustrative meeting room | synthetic |
| 19:00 | 0 | 490 | illustrative meeting room | synthetic |
| 20:00 | 0 | 450 | illustrative meeting room | synthetic |
| 21:00 | 0 | 435 | illustrative meeting room | synthetic |
| 22:00 | 0 | 430 | illustrative meeting room | synthetic |
What to agree before choosing technology
- Distinct CO₂, particle, VOC, temperature and humidity readings where in scope
- Coverage, freshness and maintenance status
- Investigation and response records
Continue exploring
Where are you on your smart building journey?
Tell us about the building, your priorities and what you want to achieve.